Project Velocity
The use of the term “Velocity” is very deliberate in Agile. Velocity is defined as the rate of change of position over time along a straight line. It is a vector quantity, adding the dimension of direction to the scalar value of speed. This applies to a software project in the sense that you may be able to move fast, but you need to know which direction you’re going. As such, Project Velocity is a measure of the rate at which business value is being delivered on the project. It isn’t simply a measure of how much time the team puts in on that work or how much code is written, but rather a measurement of value from the Customer’s perspective. The unit of measure of business value is the User Story. To measure the Project Velocity you simply take the User Stories that were completed during an iteration, and obtain a total of the estimates for the Stories. The total number of Points (or whatever unit your team is using) is your team’s Project Velocity. For example:
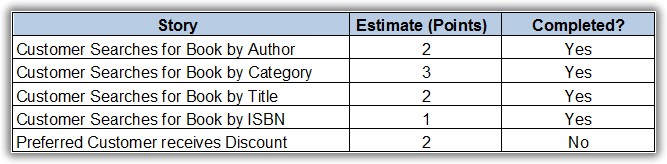
This table shows the User Stories completed for an Iteration. Four Stories were completed and one was not. For the completed Stories, the total number of points is 8. Therefore, the team’s Velocity in that Iteration was 8. That value is then used to feed the planning process for the next Iteration. This is known as Yesterday´s Weather. The team´s Velocity is also used to show how they are progressing on the overall system, and to highlight if that progress is slower or faster over time. Quite often, Burn-down or Burn-up Charts are used to highlight this:
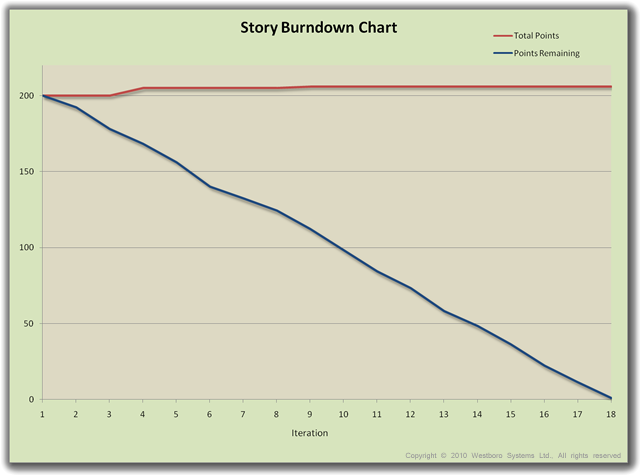
Over time, the Velocity will fluctuate for various reasons. In the Burn-down Chart, the changing velocity is shown by the changes in slope of the line. A steeper slope indicates a higher velocity, while a more shallow slope shows a lower velocity. In the chart below Iterations 7 and 8 may have taken place during a period when several team members were on vacation. In iteration 12, the team may have encountered a significant problem and had to focus on fixing the problem rather than completing stories:
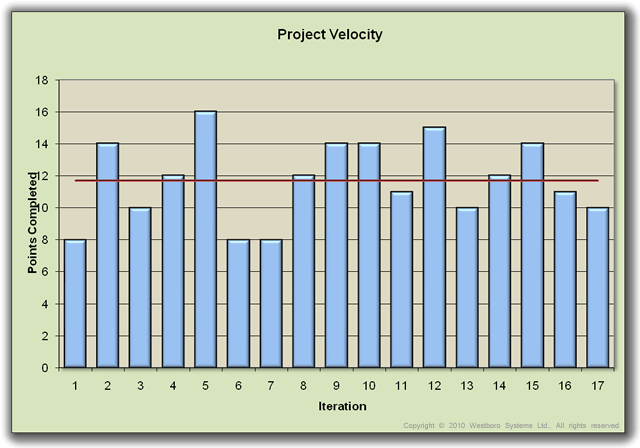
In the end, the Project Velocity always represents how much business value the team was able to deliver in a given Iteration, which is used to help determine how much they can deliver in the future.
These posts may also be interesting...
Smaller User Stories?We are the Borg
Every little thing
What problem are you trying to solve?
There’s a new look around here
Product Management
comments powered by Disqus